June 15, 2023
We use cookies on this site to improve the user experience and analyze website traffic. To learn more about how we use cookies, please see our Manage Cookies page. You can adjust your cookie settings to allow only specific types of cookies. By continuing to use our site, you are agreeing to our Privacy Policy and cookies usage.


The Portfolio Manager Commentary is provided by Trustmark’s Tailored Wealth Investment Management team. The opinions and analysis presented are accurate to the best of our knowledge and are based on information and sources that we consider to be reliable and appropriate for due consideration1.
Economic Outlook
U.S. Productivity was down 2.1% for first quarter of 2023, while Unit Labor Costs were up 4.2% for the same quarter. The NFIB Small Business Index came in at 89.4 for May. The Markit Purchasing Managers Index was 48.4 for May while the ISM Manufacturing Index was 46.9. The Markit PMI Services Index for May was 54.9 while the ISM Services Index came in at 50.3, also for May. Industrial Production in the U.S. was down 0.2% in May, while Capacity Utilization was 79.6%. The U.S. Unemployment Rate was a low 3.7% in May. Producer Prices were down 0.3% in May and up 1.1% year over year. Consumer Prices were up 0.1% in May and up 4.0% year over year. Finally, Average Hourly Earnings were up 0.3% for May and up 4.3% year over year.
Fixed Income
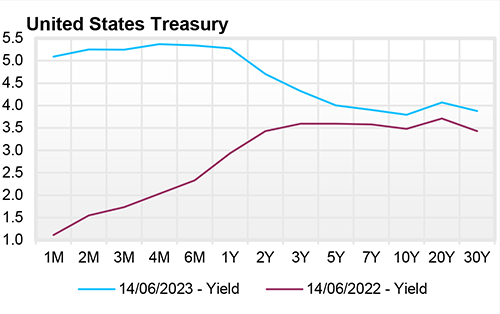
The U.S. Treasury Yield Curve remains inverted, with the 10-year yield trading at 3.77%, 95 basis points below the 2-year yield of 4.72%. At its recent June meeting, the FOMC kept the Federal Funds target rate unchanged at a range of 5.00% -5.25%. The minutes of this meeting reflect that the FOMC remains strongly committed to keeping inflation down near 2% per year while maintaining full employment. The three-month and six-month U.S. Treasury Bills currently yield in a range of 5.22%-5.31%, which does not appear to price in much in the way of further interest rate increases at this time.
Yield Curve
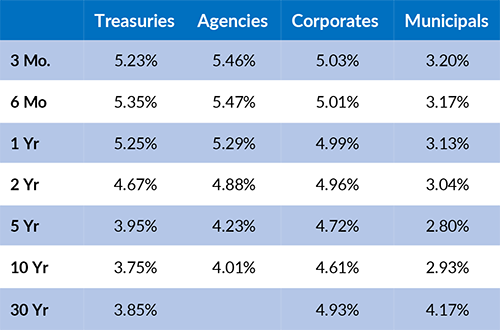
Current Generic Bond Yields
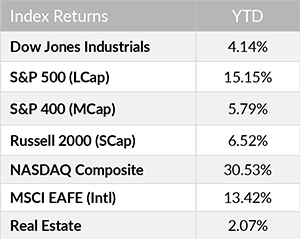
Equity
US equity hits a tailwind as the S&P 500 index gains 5% for the month and 15.15% year-to-date. The path of least resistance is up with the S&P 500 breaking an important resistance area (~4200), in which the index consolidated for multiple months without meaningful direction. Overall, this is a positive signal; however, one thing to watch is market breadth. This involves overall participation of stocks in an index’s returns and though the month of June has been a positive for breadth, the S&P 500’s returns are mostly due to the top five stocks in the index (stocks such as Apple, Microsoft, Tesla, Nvidia, Netflix) which also make up roughly 25% of the index. For example, the equal weighted S&P 500 index (where each stock plays an equal part) is up 4.5% year-to-date, compared to the cap weighted index, which is up 15%. One thing to watch and another positive sign would be for the other 495 stocks in the index to continue their momentum further, driving positive returns and exhibiting strong market conviction to the upside.
{"dialogBean":{"articleAbstract":"U.S. Productivity was down 2.1% for first quarter of 2023, while Unit Labor Costs were up 4.2% for the same quarter.","priority":"1","isFeatured":"false","isNews":"false","hideInBlogLanding":"false","trustmarkDate":"June 15, 2023","trustmarkExpirationDate":"July 26, 2026","authorBean":{"authorName":"Grant Melancon","profilePicPath":"/content/dam/trustmark/authors/author-Grant-Melancon.jpg"}},"pageTitle":"Portfolio Manager Commentary - June 15, 2023","pageThumbnail":"/content/dam/trustmark/advice/commentary/Portfolio-Manager-Commentary_th.jpg","pageTags":["trustmark:investments"],"pageTagTitles":["Investment Management"],"pageName":"15-portfolio-manager-commentary","pagePath":"/content/trustmark/trustmark/advice/2023/6/15-portfolio-manager-commentary","externalPagePath":"https://www.trustmark.com/advice/2023/6/15-portfolio-manager-commentary.html","fbAppId":"662611918413208","positioningBean":[{"layout":"small"},{"layout":"large-horizontal"},{"layout":"large-vertical"}]}
Related Articles

April 15, 2023
U.S. Factory Orders were down 0.7% in February versus having been down 2.1% in January.

May 1, 2023
The U.S. Index of Leading Economic Indicators was down 1.2% for March after having been down 0.50% for February.

May 15, 2023
The Markit Purchasing Managers’ Index (PMI™) came in at 50.2 for April versus 50.4 for April.