August 1, 2023


The Portfolio Manager Commentary is provided by Trustmark’s Tailored Wealth Investment Management team. The opinions and analysis presented are accurate to the best of our knowledge and are based on information and sources that we consider to be reliable and appropriate for due consideration1.
Economic Outlook
U.S. Retail Sales were up 0.2% in June after having been up 0.30% in May. Industrial Production was down -0.50% in June following a -0.50% decrease in May. Capacity Utilization was 78.9% in June, down a bit from the 79.40% reading in May. The Index of Leading Economic Indicators was down 0.70% in June after having been down 0.60% in May. The University of Michigan Consumer Sentiment reading was 71.6 in July versus 72.6 in June. New Single-Family Homes were sold at an annualized rate of 697,000 units in June versus 715,000 units in May. Finally, the PCE Deflator came in at +0.16% in June and 3.00% for the year ended June.
Fixed Income
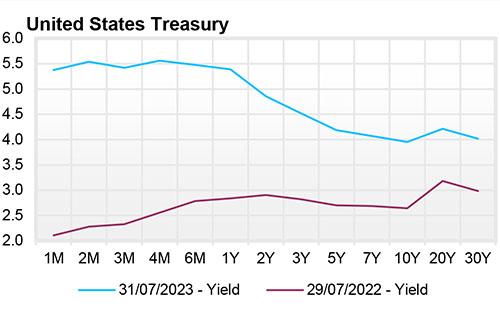
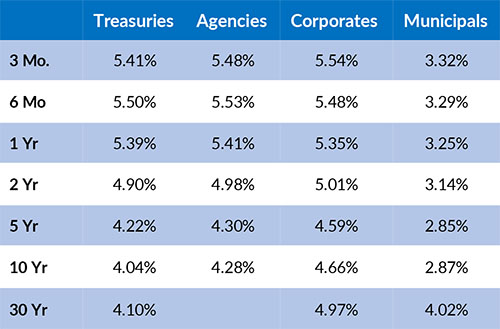
The U.S. Treasury Yield Curve remains inverted, with the 10-year yield trading at 4.09%, 82 basis points below the 2-year yield of 4.91%. At its recent July meeting, the FOMC increased the Federal Funds target rate by 25 basis points from 5.25 - 5.50. The minutes of this meeting reflect that the FOMC remains strongly committed to keeping inflation down near 2% per year while maintaining full employment. The three-month and six-month U.S. Treasury Bills currently yield in a range of 5.40%-5.50%, which now imply a higher probability of a rate hike at the next Fed meeting in September.
Yield Curve

Current Generic Bond Yields

Equity
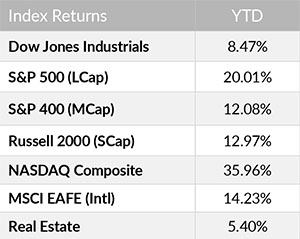
US Equity finished positive for its fifth consecutive monthly gain as the S&P 500 index notches a +2.87% return and the DJIA ties a record for thirteen straight daily gains. Eyes continue to be on the Fed and inflation as sentiment centering around a soft/no-landing scenario and disinflation drives the path of least resistance upwards. Stronger than expected Q2 GDP also provides tailwinds, though there are some concerns that if the economy is too strong, it could lead to additional rate hikes.
Growth (+24.23%) continues to lead Value (+15.34%) year-to-date as Technology (+43.18%), Communication Services (+42.96%), and Consumer Discretionary (+33.82%) outpace the worst performing sectors, Health Care (-0.73%) and Utilities (-3.37%).

Related Articles
April 15, 2023
U.S. Factory Orders were down 0.7% in February versus having been down 2.1% in January.
May 1, 2023
The U.S. Index of Leading Economic Indicators was down 1.2% for March after having been down 0.50% for February.
May 15, 2023
The Markit Purchasing Managers’ Index (PMI™) came in at 50.2 for April versus 50.4 for April.


