October 1, 2024


Economic Outlook
Final revisions for US GDP confirmed a 3% growth rate during Q2, up from a growth rate of 1.6% for Q1. Consumer spending during Q2 increased at a 2.8% annualized pace, which was in line with expectations. The US Leading Economic Index fell to 100.2 for August, continuing a decline in the index that signals caution for economic growth expectations. The Consumer Confidence Index fell to 98.7 from 105.6, the largest one-month decline since early 2021. The ISM Manufacturing Index was 47.2 for September, the sixth consecutive month below a neutral reading of 50. In August, Industrial Production levels remained unchanged from the same month a year ago. Capacity Utilization rose to 78% in August, still slightly below the long-run average. The NAHB Housing Market Index rose to 41 in September, ending four consecutive months of decline. The average interest rate for a 30-year mortgage has fallen to 6.08%.
Fixed Income
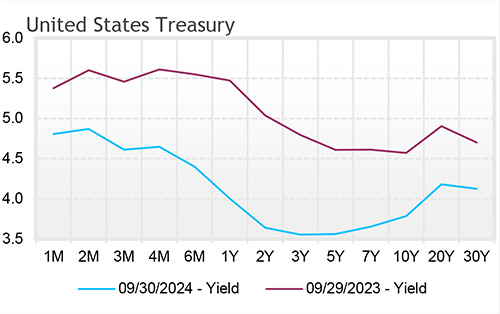
The current federal funds target rate is 4.75-5.00%. Short-duration bond rates along the U.S. Treasury Yield Curve continue to fall as the FOMC enacted a 50 bps rate cut in September. Since the announcement, long-duration bonds have edged slightly higher, as expectations of a rate cut had been fully priced before the meeting. The spread between the 10-year and 2-year Treasury rate continues to normalize, historically a sign of stable economic conditions. Market participants are attentive to how the FOMC will manage expectations following a large initial rate cut. Futures markets are split on whether the November meeting will result in a 50 bps or 25 bps rate cut. The next FOMC meeting is scheduled for November 6-7, 2024.
Yield Curve

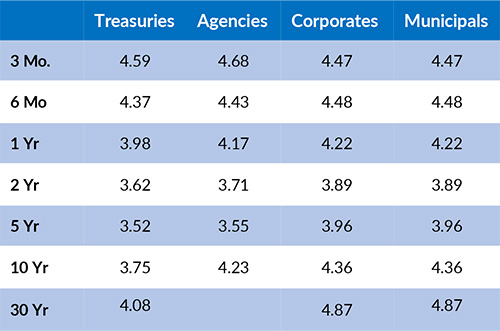
Current Generic Bond Yields

Equity
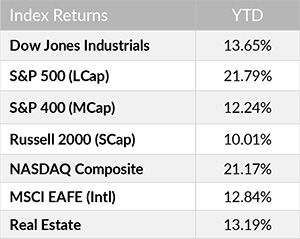
Analysts have relatively low expectations for the upcoming Q3 earnings season. The current expectation for S&P 500 Q3 year-over-year earnings growth is 4.6%; however, this value was as high as 7.8% earlier this summer. On the other hand, analysts expect year-over-year earnings growth of 15.1% for calendar year 2025. The forward 12-month PE ratio for the S&P 500 is approximately 21.6. This valuation is above the 10-year average of 18.0.
Year to date, the best performing sectors have been Information Technology (+29.63%), Communication Services (+27.88%), and Utilities (+27.45%). The worst performing sectors this year have been Energy (+5.69%), Real Estate (+11.48%), and Materials (+12.62%). On a total return basis, the Russell 1000 Growth Index has increased 24.55% year to date, while the Russell 1000 Value Index has returned 16.68% over the same period.

Related Articles
September 15, 2024
The Markit PMI Manufacturing Index came in at 47.9 for August, confirming a trend of weakness in the manufacturing sector.


