July 1, 2024


The Portfolio Manager Commentary is provided by Trustmark’s Tailored Wealth Investment Management team. The opinions and analysis presented are accurate to the best of our knowledge and are based on information and sources that we consider to be reliable and appropriate for due consideration1.
Economic Outlook
The Markit Purchasing Managers Index (PMI) logged a reading 51.6 for June, falling from 51.7 in May, whereas the ISM Manufacturing index for June was 48.5, falling from 48.7 in May. While both measures seek to identify expansion or contraction in the manufacturing sector, they currently paint differing pictures, since readings above 50 indicate economic expansion, and below 50 corresponds to contraction. Construction Spending decreased -0.10% for June, after a 0.30% increase in May. The June University of Michigan Consumer Sentiment Index came in at 68.2, down from 69.1. Sales of new single-family homes sank 11.3% month-over-month to an annualized rate of 619k in May, the lowest reading in six months. M2 money supply rose by $93.2 billion, hitting $20.963 trillion in May, reaching the highest in 15 months. Unemployment claims rose by 18,000 to 1,839,000 total as of the week ending June 15th, the highest since November 2021.
Fixed Income
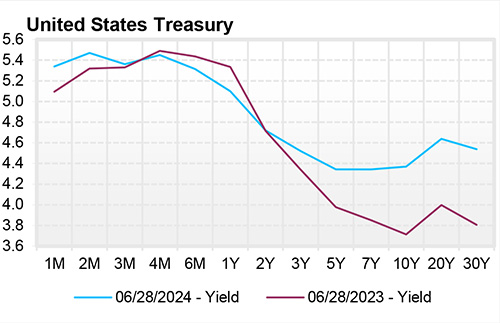
The U.S. Treasury Yield Curve has been inverted since July 2022, one of the longest inversions on record in the modern era, as the Fed has kept target rate range at 5.25 to 5.50. Roughly 65% of the market bond and futures market is positioned for a Fed rate cut in September, and over 60% expecting two more rate cuts by the end of the year. The FOMC members most recent dot plot from the June meeting depicted an expectation of only 1 rate cut by the end of the year. Either the bond market is wrong (again), and will have to adjust to the Fed’s outlook, or Fed is setting the US economy up for a hard landing, which the bond market has continually expected the last 18 months. During June, the 3M, 6M, 2Y, 3Y, and 10Y yields all decreased marginally, while the 5Y, 7Y, 20Y, 30Y all increased slightly, resulting in a somewhat flatter, but still inverted, curve.
Yield Curve

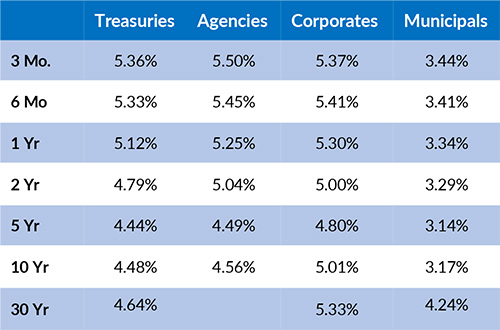
Current Generic Bond Yields

Equity
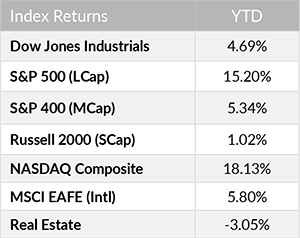
The S&P 500 Large Cap Index is positive ~15% for the first half of the year, marking the best start to a presidential election year in history. Though the S&P 500 is off to a strong start, the Russell 2000 struggles comparatively with a ~1% return year-to-date, which marks the highest level of outperformance of US large cap to small cap since 1999, and the fourth consecutive year of small cap underperformance.
Year to date, the best performing sectors have been Information Technology (+27.79%), Communication Services (+26.09%), and Financials (+9.25%). The worst performing sectors this year have been Materials (+3.13%), Consumer Discretionary (+5.22%), and Real Estate (-4.14%).

Related Articles
June 15, 2024
PPI data for May indicated that producer prices fell 0.2% month over month and have risen 2.2% over the past 12 months.


