portfolio manager commentary hero image portfolio manager commentary hero image
Thumbnail of article author - Alex Essary
By Alex Essary
August 15, 2024
Investment Management

Portfolio Manager Commentary

August 15, 2024

Economic Outlook

The ISM Services PMI was 51.4 for the month of July. The NFIB Small Business Index was 93.7 in July, the highest reading since February 2022. In the same period, the U.S. Unemployment Rate rose to 4.3%, the highest level in nearly 3 years. Average Hourly Earnings for July increased 3.6% year over year. The most recent University of Michigan Consumer Sentiment Index result was 66.4, the lowest reading of 2024. Capacity Utilization for July was 77.8%. On an annualized basis, the Producer Price Index rose 2.2% and the Consumer Price Index rose 2.9%. Both inflation readings were largely in line with consensus estimates.

Fixed Income

At the July FOMC meeting, members voted to keep the federal funds rate target unchanged at 5.25-5.50%. In recent weeks, many economists have publicly stated their fears that the Fed is acting too slow as it relates to cutting their target rate. After a few soft prints of economic data, rates across the Treasury yield curve dropped sharply in early August. The longest yield curve inversion in history was briefly interrupted earlier this month. The CME Fedwatch Tool currently predicts rate cuts totaling 75-100 bps by year-end. The next FOMC meeting is scheduled for September 17-18, 2024.

Yield Curve
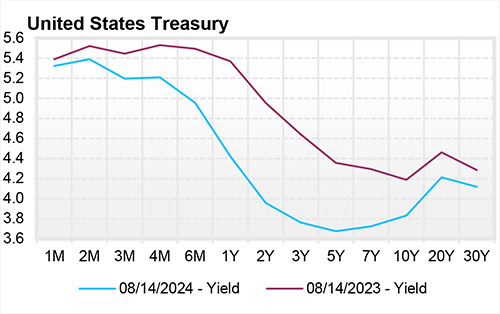
U.S. Treasury Yield Curve

Current Generic Bond Yields
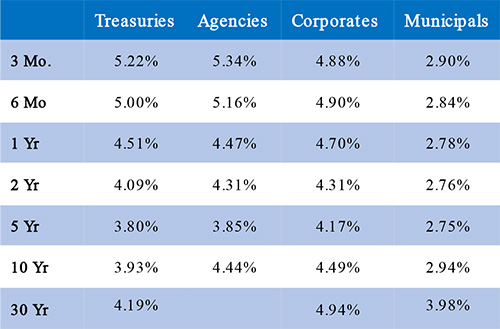
Current Generic Bond Yields

Equity

Equity markets lost some momentum in late July. Markets signaled a modest negative reaction to the July FOMC meeting. Due to overall position concentration and negative repercussions from the Yen carry trade, risk assets experienced a spike in volatility. Volatility levels quickly reverted to historically normal levels. During the past month, the equal-weight S&P 500 index has slightly outperformed the market cap-weighted S&P 500 index. The NASDAQ 100 fell over 10% during a three-week pullback. Zooming back out, equities have still delivered strong returns this year, with the S&P 500 Index up 14.74%.

Year to date, the best performing sectors have been Information Technology (+22.86%), Communication Services (+21.54%), and Utilities (+16.81%). The worst performing sectors this year have been Real Estate (+4.30%), Materials (+4.04%), and Consumer Discretionary (+0.73%).
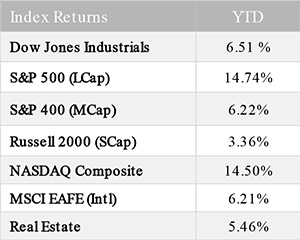
Index Returns
{"dialogBean":{"articleAbstract":"The ISM Services PMI was 51.4 for the month of July. The NFIB Small Business Index was 93.7 in July, the highest reading since February 2022.","priority":"1","isFeatured":"false","isNews":"false","hideInBlogLanding":"false","trustmarkDate":"August 15, 2024","trustmarkExpirationDate":"December 10, 2024","authorBean":{"authorName":"Alex Essary","profilePicPath":"/content/dam/trustmark/associates/ef/alex-essary_sm.jpg"}},"pageTitle":"Portfolio Manager Commentary - August 15, 2024","pageThumbnail":"/content/dam/trustmark/advice/commentary/Portfolio-Manager-Commentary_th.jpg","pageTags":["trustmark:investment-management"],"pageTagTitles":["Investment Management"],"pageName":"15-portfolio-manager-commentary","pagePath":"/content/trustmark/trustmark/advice/2024/8/15-portfolio-manager-commentary","externalPagePath":"https://www.trustmark.com/advice/2024/8/15-portfolio-manager-commentary.html","fbAppId":"662611918413208","positioningBean":[{"layout":"small"},{"layout":"large-horizontal"},{"layout":"large-vertical"}]}

Related Articles

July 1, 2024

The Markit Purchasing Managers Index (PMI) logged a reading 51.6 for June.

July 15, 2024

For the month of June, producer prices increased 2.6% year over year.

August 1, 2024

July ISM Manufacturing Index came in below expectations at 46.8 v. consensus estimates of 48.9 and June’s reading of 48.5.

1Sources of statistical information are Bloomberg, Factset Research Systems, and Ned Davis Research. Non-deposit investment products are not insured or guaranteed by any government agency or government sponsored agency of the federal government or any state; are not deposits, obligations, or guaranteed by Trustmark National Bank or its affiliates; and are subject to investment risks, including the possible loss of principal. The opinions and analysis in this report are accurate to the best of our knowledge and are based on information and sources that we consider to be reliable and appropriate for due consideration. The volatility of market conditions and any change from the basic set of assumptions used herein could lead to substantial differences in the projected results and conclusions in this report. All projections, prices and assumptions herein are subject to change without notice. We do not guarantee the results, performance or liquidity of the securities discussed and any strategy or investment selection remains your responsibility. This report is strictly for information purposes and is not intended as an offer or solicitation for any transaction. Tailored Wealth Investment Management is a division of Trustmark Wealth Management.