Thumbnail of article author - Anna Kate Rogers
By Anna Kate Rogers
September 01, 2024
Investment Management

Portfolio Manager Commentary

September 1, 2024

Economic Outlook

The August ISM Manufacturing Index was 47.2 for the month of August. The NHAB Housing Market Index was 39 for the month of August, continuing its downward trend since April. The US Leading Economic Index was 100.4 for the month of July, the lowest reading of 2024. U.S. GDP increased at an annual rate of 3.0% in the second quarter. Industrial Production decreased 0.2% year over year in July 2024. The average interest rate for a 30-year mortgage has fallen to 6.35%. A key upcoming data print, the August jobs report is set to be released September 6, 2024.

Fixed Income

At the July FOMC meeting, members voted to keep the federal funds rate target unchanged at 5.25-5.50%. The 10-year yield is currently 3.83%, 3 basis points below the 2-year yield of 3.86%. After an inversion that lasted over 2 years, the U.S. Treasury Yield Curve has normalized for brief periods in recent weeks. Yields on short-term bonds have fallen to their lowest levels in 2024 as investors expect rate cuts in the near future. The next FOMC meeting is scheduled for September 17-18, 2024.

Yield Curve
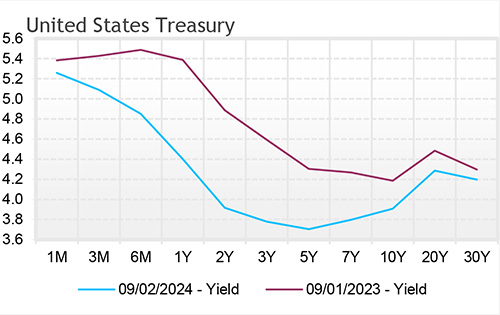
Yield curve

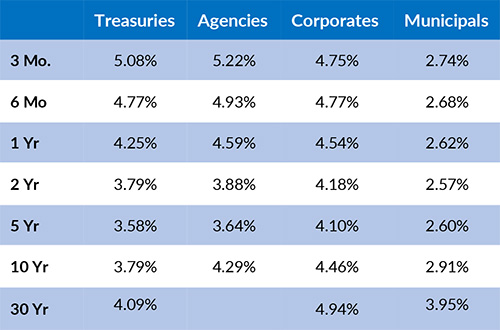
Current Generic Bond Yields

Current Generic Bond Yields

Equity

Most S&P 500 companies reported earnings in recent weeks. Given the strong performance in equities in 2024, most large cap and growth indices are above their long-term average valuations. The S&P 500’s trailing P/E multiple is currently 25.34, the NASDAQ Composite’s multiple is 30.48, and the equal-weight S&P 500’s multiple is 20.05. The blended earnings growth rate for the S&P 500 during Q2 2024 was approximately 10.9%, which marks the highest year over year increase since Q4 2021.

Year to date, the best performing sectors have been Information Technology (+26.53%), Communication Services (+22.34%), and Financials (+21.21%). The worst performing sectors this year have been Energy (+8.72%), Real Estate (+8.47%), and Consumer Discretionary (+5.79%). On a total return basis, the Russell 1000 Growth Index has increased 17.51% year to date, while the Russell 1000 Value Index has returned 13.67% over the same period.
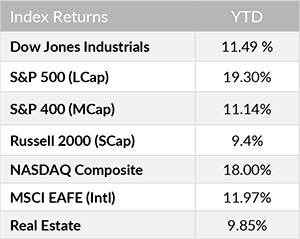
Index Returns
{"dialogBean":{"articleAbstract":"The August ISM Manufacturing Index was 47.2 for the month of August.","priority":"1","isFeatured":"false","isNews":"false","hideInBlogLanding":"false","trustmarkDate":"September 01, 2024","trustmarkExpirationDate":"December 12, 2024","authorBean":{"authorName":"Anna Kate Rogers","profilePicPath":"/content/dam/trustmark/authors/anna-kate-rogers_sm.jpg"}},"pageTitle":"Portfolio Manager Commentary - September 1, 2024","pageThumbnail":"/content/dam/trustmark/advice/commentary/Portfolio-Manager-Commentary_th.jpg","pageTags":["trustmark:investment-management"],"pageTagTitles":["Investment Management"],"pageName":"01-portfolio-manager-commentary","pagePath":"/content/trustmark/trustmark/advice/2024/9/01-portfolio-manager-commentary","externalPagePath":"https://www.trustmark.com/advice/2024/9/01-portfolio-manager-commentary.html","fbAppId":"662611918413208","positioningBean":[{"layout":"small"},{"layout":"large-horizontal"},{"layout":"large-vertical"}]}

Related Articles

August 15, 2024

The ISM Services PMI was 51.4 for the month of July.

August 1, 2024

July ISM Manufacturing Index came in below expectations at 46.8 v. consensus estimates of 48.9 and June’s reading of 48.5.

July 15, 2024

For the month of June, producer prices increased 2.6% year over year.

1Sources of statistical information are Bloomberg, Factset Research Systems, and Ned Davis Research. Non-deposit investment products are not insured or guaranteed by any government agency or government sponsored agency of the federal government or any state; are not deposits, obligations, or guaranteed by Trustmark National Bank or its affiliates; and are subject to investment risks, including the possible loss of principal. The opinions and analysis in this report are accurate to the best of our knowledge and are based on information and sources that we consider to be reliable and appropriate for due consideration. The volatility of market conditions and any change from the basic set of assumptions used herein could lead to substantial differences in the projected results and conclusions in this report. All projections, prices and assumptions herein are subject to change without notice. We do not guarantee the results, performance or liquidity of the securities discussed and any strategy or investment selection remains your responsibility. This report is strictly for information purposes and is not intended as an offer or solicitation for any transaction. Tailored Wealth Investment Management is a division of Trustmark Wealth Management.