October 15, 2025
We use cookies on this site to improve the user experience and analyze website traffic. To learn more about how we use cookies, please see our Manage Cookies page. You can adjust your cookie settings to allow only specific types of cookies. By continuing to use our site, you are agreeing to our Privacy Policy and cookies usage.


Economic Outlook
In September, the ISM Services PMI registered at 50.0, indicating neutral levels of service sector activity. The NFIB Small Business Optimism Index declined to 98.8, with supply chain disruptions and inflation emerging as areas of concern for some respondents. Due to the ongoing federal government shutdown, the Bureau of Labor Statistics has not published September data that includes the U.S. unemployment rate, the consumer price index, and the producer price index. The ADP Employment Report indicated that the private sector shed 32,000 jobs in September while wages increased 4.5% from a year ago. Consumer sentiment was little changed, with the University of Michigan index posting a preliminary October reading of 55.0. The average interest rate for a 30-year fixed-rate mortgage was approximately 6.42% as of October 10.
Fixed Income
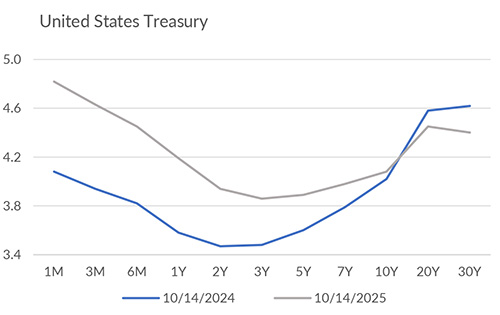
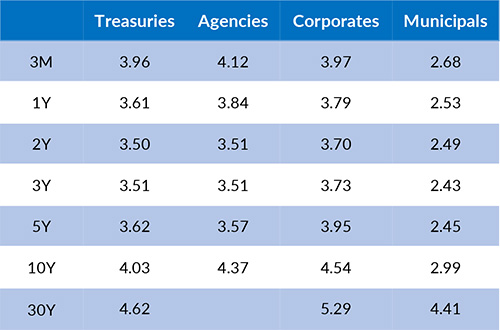
The Federal Reserve lowered the federal funds target range by 25 bps to 4.00%–4.25% at the September meeting. Futures pricing now implies there will be a 25 bps rate cut at the October and December meetings. However, if the federal government shutdown continues, the FOMC Board may be slow to act due to missing or delayed economic data. Treasury yields across the curve remain near lowest levels in the past six months. The 2-year Treasury yield is 3.50% and the 10-year yield sits at 4.03%, leaving the yield curve modestly positive. Looking ahead, markets will focus on incoming data and the October 29 FOMC meeting for confirmation of the expected easing path.
Yield Curve
Current Generic Bond Yields
Equities
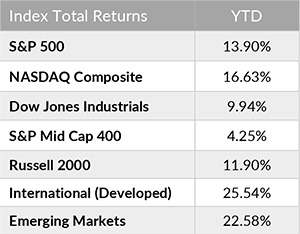
Market volatility increased during the start of Q4, with the CBOE Volatility Index increasing over 40% from October 1 to the intraday high on October 14. This week represents the start of Q3 earnings season, with approximately 7% of S&P 500 companies announcing Q3 results from October 13-17. The S&P 500 earnings growth rate has exceeded estimates for 10 consecutive quarters. U.S. Large Cap valuations remain moderately elevated as the trailing P/E ratio for the S&P 500 is currently 27.4. This P/E ratio is above the 10-year average (22.0) and the 5-year average (24.1). In the AAII survey for the week ending October 8, 45.9% of respondents identified as “bullish”- the highest share of respondents since December 2024.
In 2025, the best performing U.S. sectors have been Utilities (+23.70%), Communication Services (+22.90%), and Information Technology (+21.29%). The worst performing sectors have been Consumer Discretionary (+3.02%), Energy (+3.75%), and Real Estate (+3.99%). On a total return basis, the Russell 1000 Growth Index has returned 16.33% year to date, while the Russell 1000 Value Index has increased 11.38% over the same period.
{"dialogBean":{"articleAbstract":"In September, the ISM Services PMI registered at 50.0, indicating neutral levels of service sector activity.","priority":"1","isFeatured":"false","isNews":"false","hideInBlogLanding":"false","trustmarkDate":"October 15, 2025","trustmarkExpirationDate":"July 27, 2026","authorBean":{"authorName":"Alex Essary","profilePicPath":"/content/dam/trustmark/associates/ef/alex-essary_sm.jpg"}},"pageTitle":"Portfolio Manager Commentary - October 15, 2025","pageThumbnail":"/content/dam/trustmark/advice/commentary/Portfolio-Manager-Commentary_th.jpg","pageTags":["trustmark:investment-management"],"pageTagTitles":["Investment Management"],"pageName":"15-portfolio-manager-commentary","pagePath":"/content/trustmark/trustmark/advice/2025/10/15-portfolio-manager-commentary","externalPagePath":"https://www.trustmark.com/advice/2025/10/15-portfolio-manager-commentary.html","fbAppId":"662611918413208","positioningBean":[{"layout":"small"},{"layout":"large-horizontal"},{"layout":"large-vertical"}]}
Related Articles


September 15, 2025
In August, the ISM Services PMI rose to 52.0, indicating modest expansion in the services sector.

September 1, 2025
The U.S. Leading Economic Index declined slightly in July to 98.7, marking the eighth consecutive month with a decrease or an unchanged reading for the index.