June 1, 2025
We use cookies on this site to improve the user experience and analyze website traffic. To learn more about how we use cookies, please see our Manage Cookies page. You can adjust your cookie settings to allow only specific types of cookies. By continuing to use our site, you are agreeing to our Privacy Policy and cookies usage.


Economic Outlook
The U.S. Leading Economic Index declined by 1.0% in April to 99.4, marking its fifth consecutive monthly decrease and signaling potential headwinds for future economic activity. The ISM Manufacturing PMI registered 48.5 in May, indicating a continued contraction in the manufacturing sector. Industrial production remained unchanged in April. The University of Michigan Consumer Sentiment Index remained unchanged at 52.2 in May, halting a four-month decline but still reflecting subdued consumer confidence. The 5-Year Breakeven Inflation Rate stood at 2.39% as of May 30, suggesting stable medium-term inflation expectations. Capacity Utilization decreased to 77.7% in April from 77.8% in March. Average hourly earnings increased by 0.2% in April to $36.06, with a year-over-year growth rate of 3.8%, reflecting steady wage growth. The NAHB Housing Market Index fell to 34 in May, down six points from April, near the lowest levels seen over the past 5 years. The average interest rate for a 30-year fixed-rate mortgage was approximately 6.89% as of May 29.
Fixed Income
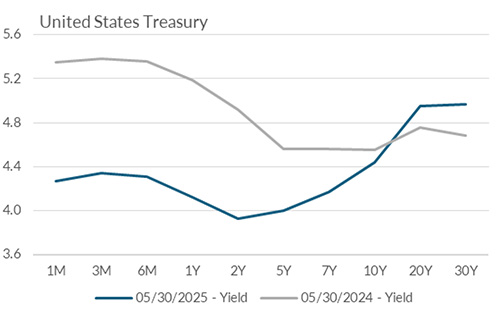
The current federal funds target rate remains at 4.25–4.50%. The 2-year yield is currently 3.93%, 51 basis points below the 10-year yield of 4.44%. Since the end of April, U.S. Treasury yields have traded within a relatively narrow range, with intermediate and long-duration yields rising slightly due to geopolitical risks and Federal debt concerns. The 2-year Treasury yield has climbed modestly from a low near 3.60% on April 30, as markets reassess the likelihood of near-term Fed action. While futures markets expect at least one rate cut in the second half of the year, improving labor market data and resilient corporate earnings have tempered expectations for aggressive easing. The next FOMC meeting is scheduled for June 17-18, 2025.
Yield Curve
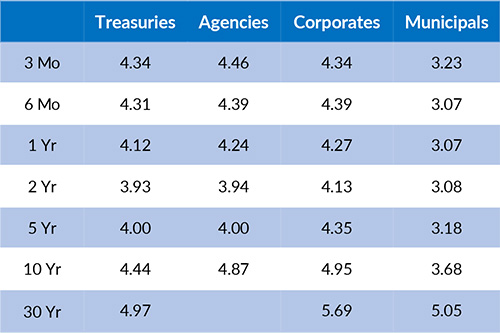
Current Generic Bond Yields
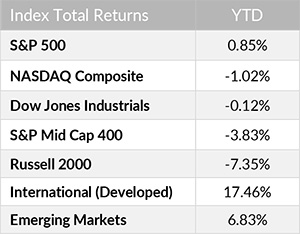
Equity
The S&P 500 Index rose 1.88% for the week ending May 30, the largest weekly increase in nearly 18 months. For the month of May, the Index rose 6.15%. With 98% of S&P 500 companies reporting Q1 2025 earnings, the current earnings growth rate for the quarter sits at 13.3%, which is well above the estimate of 7.2% as of March 31. From a valuation perspective, the S&P 500 has a forward P/E ratio of 21.3. This is above the 10-year average of 18.4.
In 2025, the best performing U.S. sectors have been Industrials (+8.22%), Utilities (+7.67%), and Consumer Staples (+7.46%). The worst performing sectors have been Consumer Discretionary (-6.21%), Energy (-5.42%), and Health Care (-3.82%). On a total return basis, the Russell 1000 Growth Index has returned -0.27% year to date, while the Russell 1000 Value Index has increased 2.50% over the same period.
{"dialogBean":{"articleAbstract":"The U.S. Leading Economic Index declined by 1.0% in April to 99.4.","priority":"1","isFeatured":"false","isNews":"false","hideInBlogLanding":"false","trustmarkDate":"June 01, 2025","trustmarkExpirationDate":"July 28, 2026","authorBean":{"authorName":"Alex Essary","profilePicPath":"/content/dam/trustmark/associates/ef/alex-essary_sm.jpg"}},"pageTitle":"Portfolio Manager Commentary - June 1, 2025","pageThumbnail":"/content/dam/trustmark/advice/commentary/Portfolio-Manager-Commentary_th.jpg","pageTags":["trustmark:investment-management"],"pageTagTitles":["Investment Management"],"pageName":"01-portfolio-manager-commentary","pagePath":"/content/trustmark/trustmark/advice/2025/6/01-portfolio-manager-commentary","externalPagePath":"https://www.trustmark.com/advice/2025/6/01-portfolio-manager-commentary.html","fbAppId":"662611918413208","positioningBean":[{"layout":"small"},{"layout":"large-horizontal"},{"layout":"large-vertical"}]}
Related Articles

May 15, 2025
In April, the S&P Global U.S. Manufacturing PMI held steady at 50.2, indicating marginal expansion in the manufacturing industry.


April 15, 2025
The Markit PMI Manufacturing Index fell to 49 in March from February's reading of 50.3.