July 1, 2025
We use cookies on this site to improve the user experience and analyze website traffic. To learn more about how we use cookies, please see our Manage Cookies page. You can adjust your cookie settings to allow only specific types of cookies. By continuing to use our site, you are agreeing to our Privacy Policy and cookies usage.


Economic Outlook
The U.S. Leading Economic Index declined to 99.0 in May, signaling potential headwinds for future economic activity. The ISM Manufacturing Index registered 49.0 in June, indicating a slight contraction in the manufacturing sector. Industrial Production increased 0.6% year-over-year in May, reflecting modest growth. The University of Michigan Consumer Sentiment Index posted a final reading of 60.7 in June, showing a notable improvement in consumer confidence compared to the prior three months. The 5-Year Breakeven Inflation Rate stood at 2.31% as of June 30, suggesting stable medium-term inflation expectations. Capacity Utilization decreased to 77.4% in May, the third consecutive monthly decline. Average hourly earnings rose 3.9% year-over-year, reflecting steady wage growth relative to prior months. The NAHB Housing Market Index fell to 32 in June, highlighting continued weakness in the housing sector. The average interest rate for a 30-year fixed-rate mortgage was approximately 6.77% as of June 26.
Fixed Income
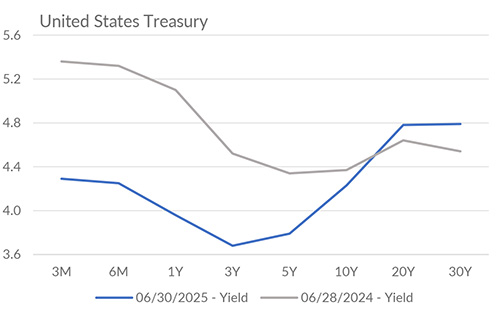
The Federal Reserve maintained the federal funds target rate at 4.25–4.50% during the first half of 2025, with its June dot plot projecting one or two quarter-point rate cuts later this year. The 2-year Treasury yield, highly sensitive to changes in the FOMC target rate, declined from as high as 4.39% in early January to approximately 3.71% by late June, reflecting growing investor confidence in eventual policy easing. Meanwhile, the 10-year Treasury yield, which has ranged from 4.79% to 4.01% thus far in 2025, settled near 4.21% by the end of June. The next FOMC meeting is scheduled for July 29-30, 2025.
Yield Curve
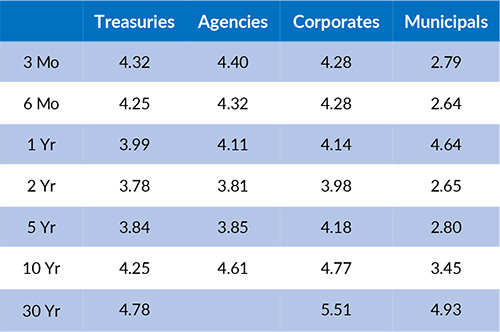
Current Generic Bond Yields
Equity
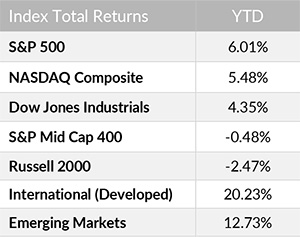
The U.S. equity market delivered a robust rebound in the first half of 2025, with the S&P 500, Nasdaq Composite, and Dow Jones Industrial Average all closing June at or near record highs. Following a sharp 20% plunge in the S&P 500 in early April, triggered by President Trump’s sweeping “Liberation Day” tariffs, a swift policy retreat and easing trade tensions helped power a strong recovery in the subsequent weeks. As we head into the second half, optimism surrounding corporate earnings, potential Fed rate cuts, and continued AI deployment is tempered by potential renewed trade policy volatility and current valuations. The current trailing P/E ratio for the S&P 500 is 26.27, above the index’s average trailing P/E of 19.25 since 2000.
In 2025, the best performing U.S. sectors have been Industrials (+12.72%), Communication Services (+11.13%), and Utilities (+9.41%). The worst performing sectors have been Consumer Discretionary (-3.87%), Health Care (-1.11%), and Energy (+0.77%). On a total return basis, the Russell 1000 Growth Index has returned 6.09% year to date, while the Russell 1000 Value Index has increased 6.00% over the same period.
{"dialogBean":{"articleAbstract":"The U.S. Leading Economic Index declined to 99.0 in May, signaling potential headwinds for future economic activity.","priority":"1","isFeatured":"false","isNews":"false","hideInBlogLanding":"false","trustmarkDate":"July 01, 2025","trustmarkExpirationDate":"July 28, 2026","authorBean":{"authorName":"Alex Essary","profilePicPath":"/content/dam/trustmark/associates/ef/alex-essary_sm.jpg"}},"pageTitle":"Portfolio Manager Commentary - July 1, 2025","pageThumbnail":"/content/dam/trustmark/advice/commentary/Portfolio-Manager-Commentary_th.jpg","pageTags":["trustmark:investment-management"],"pageTagTitles":["Investment Management"],"pageName":"01-portfolio-manager-commentary","pagePath":"/content/trustmark/trustmark/advice/2025/7/01-portfolio-manager-commentary","externalPagePath":"https://www.trustmark.com/advice/2025/7/01-portfolio-manager-commentary.html","fbAppId":"662611918413208","positioningBean":[{"layout":"small"},{"layout":"large-horizontal"},{"layout":"large-vertical"}]}
Related Articles

June 15, 2025
In May, the ISM Services PMI declined to 49.9, indicating a modest contraction in the services sector.


May 15, 2025
In April, the S&P Global U.S. Manufacturing PMI held steady at 50.2, indicating marginal expansion in the manufacturing industry.