July 1, 2026

We use cookies on this site to improve the user experience and analyze website traffic. To learn more about how we use cookies, please see our Manage Cookies page. You can adjust your cookie settings to allow only specific types of cookies. By continuing to use our site, you are agreeing to our Privacy Policy and cookies usage.


Economic Outlook
The Atlanta Fed GDPNow model currently estimates second quarter real GDP growth of 1.2%, down from 3.0% one month ago. The Conference Board Leading Economic Index increased 0.1% in May following a 0.2% increase in April. The ISM Services Index increased to 54.5 from 53.6 in April, the strongest gain in the services sector in three months. The University of Michigan Consumer Sentiment index was revised higher to 49.5 in June, up from 44.8. The labor market remains resilient, with the unemployment rate held at 4.3% for the third consecutive month, while average hourly earnings increased 3.4% year-over-year. Forward inflation expectations fell sharply since last month, with the 5-year breakeven inflation rate at 2.26%. The average interest rate for a 30-year fixed-rate mortgage was approximately 6.49% as of June 25.
Fixed Income
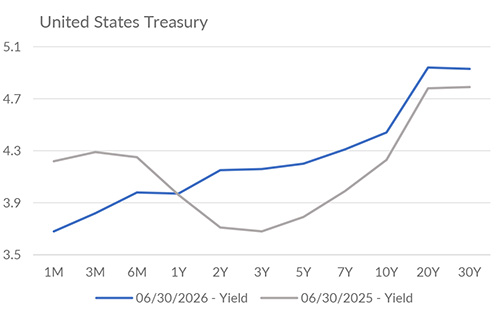
The Federal Reserve left the federal funds target range unchanged at its June meeting. However, the tone surrounding the meeting was viewed by many market participants as more hawkish than expected, prompting investors to strengthen expectations for rate hikes later this year. Policymakers signaled a stronger commitment to restoring price stability, contributing to higher volatility for short-term Treasury yields. Notably, credit markets have remained relatively constructive despite the shift in policy expectations, with BB versus BBB credit spreads suggesting limited signs of stress. The combination of resilient economic activity and anchored inflation expectations has continued to support investor confidence in corporate credit fundamentals. As of July 1, futures markets are pricing in 25-50 bps of federal funds target range cuts by the end of the year.
Yield Curve
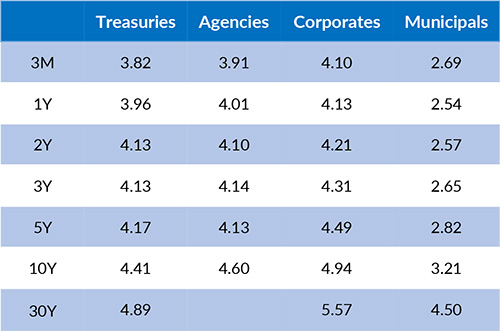
Current Generic Bond Yields
Equities
Despite a notable pullback in several mega-cap technology stocks, market breadth continued to improve in June. The equal-weight S&P 500 recently reached new highs, while the Magnificent 7 Index declined nearly 8% during the month. The week ending June 26 marked the second-best week for equal-weight versus cap-weighted S&P 500 performance since the COVID recovery. Supporting the improvement of breadth, the one-year rolling correlation between the S&P 500 Equal Weight Index and the S&P 500 recently fell to the lowest level in the history of the data series, highlighting the divergence in performance between the average stock and the market's largest constituents.
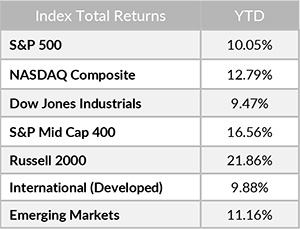
In 2026, the best performing U.S. sectors have been Industrials (+20.15%), Information Technology (+19.76%), and Energy (+19.66%). The worst performing sectors have been Financials (-1.18%), Consumer Discretionary (-0.77%), and Consumer Services (0.80%). On a total return basis, the Russell 1000 Growth Index returned 5.33% year to date, while the Russell 1000 Value Index increased 16.26% over the same period.
{"dialogBean":{"articleAbstract":"The Atlanta Fed GDPNow model currently estimates second quarter real GDP growth of 1.2%, down from 3.0% one month ago.","priority":"1","isFeatured":"false","isNews":"false","hideInBlogLanding":"false","trustmarkDate":"July 01, 2026","trustmarkExpirationDate":"August 24, 2026","authorBean":{"authorName":"Alex Essary","profilePicPath":"/content/dam/trustmark/associates/ef/alex-essary_sm.jpg"}},"pageTitle":"Portfolio Manager Commentary - July 1, 2026","pageThumbnail":"/content/dam/trustmark/advice/commentary/Portfolio-Manager-Commentary_th.jpg","pageTags":["trustmark:investment-management"],"pageTagTitles":["Investment Management"],"pageName":"01-portfolio-manager-commentary","pagePath":"/content/trustmark/trustmark/advice/2026/7/01-portfolio-manager-commentary","externalPagePath":"https://www.trustmark.com/advice/2026/7/01-portfolio-manager-commentary.html","fbAppId":"662611918413208","positioningBean":[{"layout":"small"},{"layout":"large-horizontal"},{"layout":"large-vertical"}]}

Related Articles


June 1, 2026
The Atlanta Federal Reserve currently estimates real GDP growth of approximately 3.0% for Q2 2026, suggesting continued economic resilience.