January 15, 2024


The Portfolio Manager Commentary is provided by Trustmark’s Tailored Wealth Investment Management team. The opinions and analysis presented are accurate to the best of our knowledge and are based on information and sources that we consider to be reliable and appropriate for due consideration1.
Economic Outlook
The Markit PMI Manufacturing Index came in at 47.9 for December, approximately in-line with November. The ISM Manufacturing Index was at approximately the same level. The Market PMI Service Index came in at 51.4 for December, or slightly expansionary. The NFIB Small Business Index also came in somewhat positively, at 91.9 for December. The U.S. Unemployment Rate was flat at 3.7% for December versus November. Producer prices were down 0.10% for December and up 1.0% year over year. Consumer Prices were up 0.3% for December and up 3.4% year over year. Finally, Average Hourly Earnings were up 0.4% for December and up 4.1% year over year.
Fixed Income
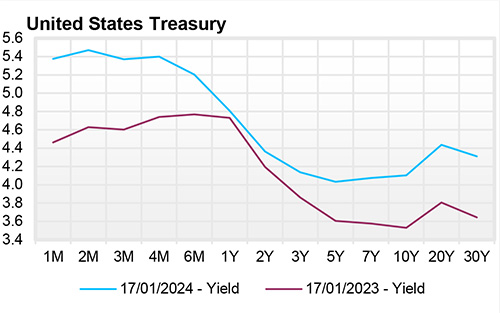
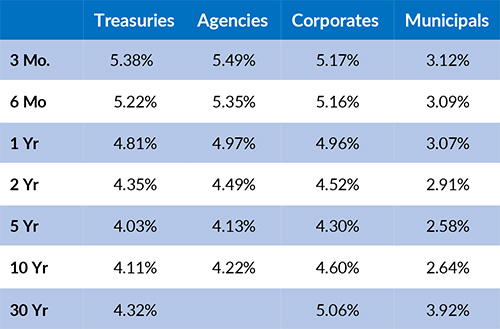
The U.S. Treasury Yield Curve remains inverted; however, this inversion has continued to remain somewhat flatter, with the 10-year yield at 4.05%, 17 basis points below the 2-year yield of 4.21%. The U.S. Treasury Yield Curve has now been inverted for 18 months. At its recent meeting, the FOMC left the Federal Funds target rate range at 5.25% - 5.50%. The FOMC also removed language that implied future interest rate increases and introduced language that implied future interest rate cuts. The FOMC also noted that the U.S. Unemployment Rate will likely continue trending higher to the 4.1% level as we head further into 2024. The three-month and six-month U.S. Treasury Bills currently yield in a range of 5.20%-5.37%, which is within the range of the FOMC’s current Fed Funds rate target. U.S. Treasury Bill yields out seven to eight months (August of 2024) are now yielding 5.00%, or slightly below the target rate in anticipation of a first interest rate cut.
Yield Curve

Current Generic Bond Yields

Equity
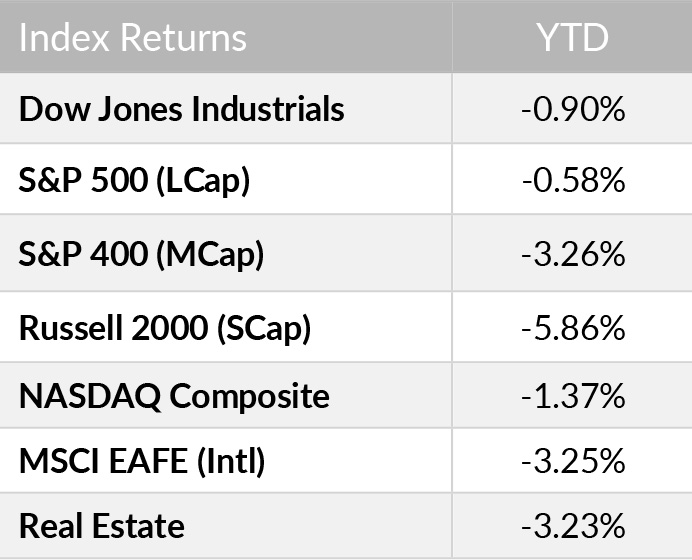
The S&P 500 is down -0.58% YTD. The leading sectors of the year are Health Care (+2.56%), Consumer Staples (0.83%), and Communication Services (1.00%). The largest sector drawdowns for the year are in Energy (-4.03%) and Materials (-4.21%). Even given the slower start to the year, always keep in mind that since 1928, the average annualized return of the S&P 500 has been 9.8% with the average intra-year drawdown of -16.4%.
The United States is still reigning as the largest and most dominant stock market in the world . The total equity market capitalization of the US is around $50 billion, with China, being the next largest, falling around $10 billion in market capitalization. While the markets are pricing in multiple rate cuts throughout 2024, there is growing skepticism about the number of cuts forecasted throughout the year. With rising geopolitical tension, and doubt about the Fed’s future dovish policies, the US Dollar has strengthened, given it can be viewed as a ‘safe haven’ given global economic uncertainty.

Related Articles
December 1, 2023
U.S. Durable Goods Orders were down 5.4% in October versus having been up in September.
December 15, 2023
U.S. Durable Goods Orders were down 5.4% in October. Industrial Production was up 0.2% in November and Capacity Utilization came in at 78.8%.
January 1, 2024
The U.S. Index of Leading Economic Indicators was down 0.50% in November after having been down 1.00% in October.


