August 1, 2025
We use cookies on this site to improve the user experience and analyze website traffic. To learn more about how we use cookies, please see our Manage Cookies page. You can adjust your cookie settings to allow only specific types of cookies. By continuing to use our site, you are agreeing to our Privacy Policy and cookies usage.


Economic Outlook
The U.S. Leading Economic Index declined to 98.8 in June, marking the sixth decline in the past seven months and suggesting continued softening in forward-looking indicators. The ISM Manufacturing PMI registered 48.0 in July, indicating an ongoing contraction in the manufacturing sector. Industrial Production rose 0.7% year-over-year in June, reflecting modest growth. The University of Michigan Consumer Sentiment Index posted a final reading of 61.7 in July, showing resilience since the weak readings from April and May. The 5-Year Breakeven Inflation Rate stood at 2.38% as of August 1, pointing to stable medium-term inflation expectations. Capacity Utilization increased slightly to 77.6% in June from 77.5% in May. Average hourly earnings rose by 0.3% in July, reflecting a year-over-year growth rate of 3.9%. The average interest rate for a 30-year fixed-rate mortgage was approximately 6.72% as of July 31.
Fixed Income
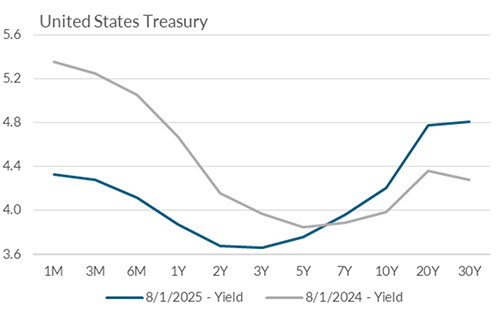
The Federal Reserve maintained the federal funds target rate at 4.25–4.50% at its July 30 meeting, reaffirming its data-dependent approach. During the most recent meeting, two Fed Governors voted against the central bank’s consensus to leave rates unchanged. U.S. Treasury yields fell sharply following the weak July jobs report, with the 2-year Treasury yield falling by 25 basis points on August 1. The 2-year yield is currently 3.70%, 52 basis points below the 10-year yield of 4.22%. Market participants now see a high probability of a Fed rate cut in September, given weak labor data and tariff concerns.
Yield Curve
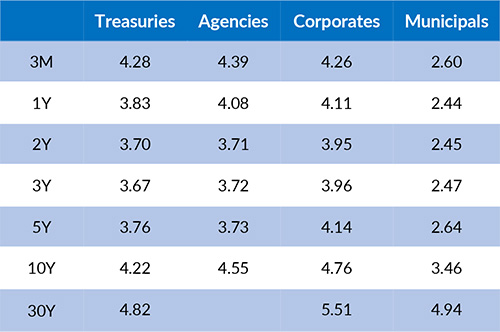
Current Generic Bond Yields
Equity
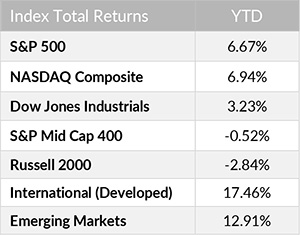
Equity markets entered August on an uneven footing following a strong July, as investors balanced solid corporate earnings against macroeconomic uncertainty. The S&P 500 posted a total return of 2.24% in July, bringing its year-to-date gain to 6.67%. The second quarter earnings season has exceeded expectations, with 82% of S&P 500 companies reporting positive earnings surprises. Aggregate year-over-year EPS growth is currently tracking near 10%, driven by Technology, Communication Services, and Financials. The trailing P/E ratio for the S&P 500 is 26.5, above the 5-year average (24.0) and the 10-year average (21.8).
In 2025, the best performing U.S. sectors have been Utilities (+14.97%), Industrials (+14.42%), and Communication Services (+11.95%). The worst performing sectors have been Consumer Discretionary (-4.87%), Health Care (-3.77%), and Energy (+1.92%). On a total return basis, the Russell 1000 Growth Index has returned 7.97% year to date, while the Russell 1000 Value Index has increased 5.24% over the same period.
{"dialogBean":{"articleAbstract":"The U.S. Leading Economic Index declined to 98.8 in June, marking the sixth decline in the past seven months.","priority":"1","isFeatured":"false","isNews":"false","hideInBlogLanding":"false","trustmarkDate":"August 01, 2025","trustmarkExpirationDate":"December 14, 2025","authorBean":{"authorName":"Alex Essary","profilePicPath":"/content/dam/trustmark/associates/ef/alex-essary_sm.jpg"}},"pageTitle":"Portfolio Manager Commentary - August 1, 2025","pageThumbnail":"/content/dam/trustmark/advice/commentary/Portfolio-Manager-Commentary_th.jpg","pageTags":["trustmark:investment-management"],"pageTagTitles":["Investment Management"],"pageName":"01-portfolio-manager-commentary","pagePath":"/content/trustmark/trustmark/advice/2025/8/01-portfolio-manager-commentary","externalPagePath":"https://www.trustmark.com/advice/2025/8/01-portfolio-manager-commentary.html","fbAppId":"662611918413208","positioningBean":[{"layout":"small"},{"layout":"large-horizontal"},{"layout":"large-vertical"}]}
Related Articles

July 15, 2025
In June, the ISM Services PMI rose to 50.8, up slightly from 49.9 in May, indicating relatively stable service sector activity

July 1, 2025
The U.S. Leading Economic Index declined to 99.0 in May, signaling potential headwinds for future economic activity.

June 15, 2025
In May, the ISM Services PMI declined to 49.9, indicating a modest contraction in the services sector.